The processed Lincolnshire fenland lidar plot ultimately encompassed some 2250km2 and was always a difficult thing to share (it sits now in various repositories in 5km- and 10km-square blocks). The full resolution 3Gb tif image probably still counts as 'large' in these days of Tb disks (much easier to store, still not very easy to transmit). But finally, through the medium of Leaflet, a zoomable, pannable, map awaits. Just follow the image link above or read on to find out more about the project, the processing involved, and what the colour scales you see actually indicate. The leaflet map loads with a straightforward OpenStreetMap background. Lidar and other map layers can be selected from the drop-down menu. There are two lidar layers. Fens2012 contains the layers originally served from the earlier version of this site (Fens, Marsh and Cambs; the distinctions not now relevant) in a not-entirely-seamless map (see below) of 5250km2 in total. FensNLP is the updated, and rather more (if not entirely) seamless version. The full mosaic encompasses some 7800km2 and at 1m resolution approaches 40Gb.
Archaeological study of the Fenland has a long history. Too long to revisit here, but key studies would include The Fenland in Roman Times (Phillips 1970) and the eleven Fenland Project volumes published between 1985 and 1996 (now all available online), and not to mention everything about Flag Fen, Must Farm, Stonea, the Car Dyke, and much more. A defining point, recognised from an early date, is the influence of fine topography on the patterns of settlement in these landscapes of very low relief. The Fenland Project mapping made a particular point of including detail of the networks of roddons, the extinct silt-filled creeks which provided firmer ground within the peat fen, mapped then from aerial photography and field survey. The lidar dataset allows these to be extensively and consistently mapped across the whole of the fenland. No other source of mapping comes close to providing this level of topographic detail.
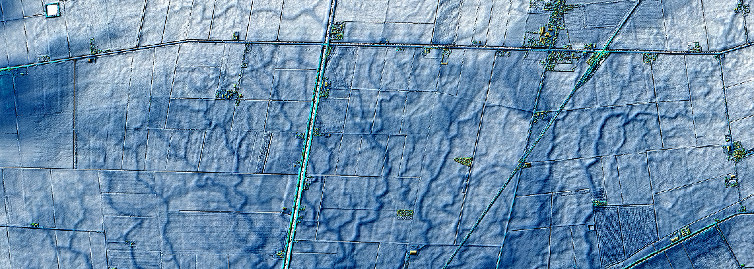
Dendritic pattern of drainage southwards from East Fen overlying earlier watercourses draining eastwards (and here somewhat northwards) towards the (former) coast in the vicinity of Wainfleet.
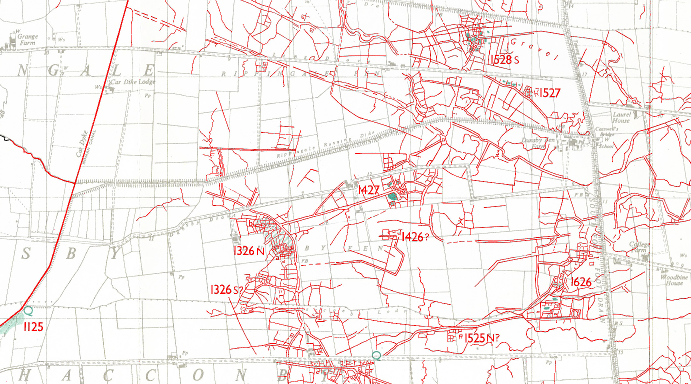
The point, of course, is to see the extensive and detailed cropmark landscapes of the fens against the lidar map, showing how the locations of settlement sites and routes of trackways and watercourses are influenced by this fine-scale topography, revealed in detail for the first time.
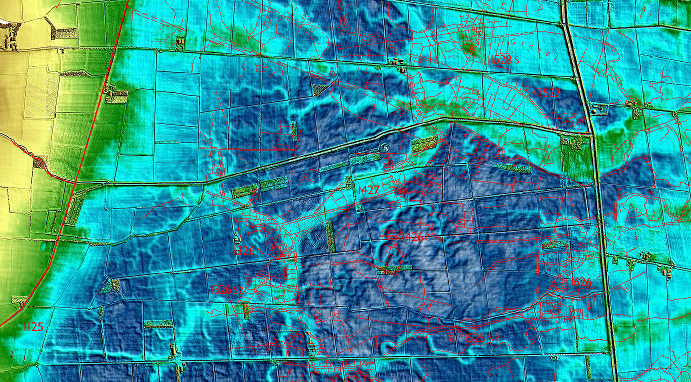
Cropmarks in Rippingale and Dunsby Fen. After The Fenland in Roman Times Map 2 (top); overlain on the lidar topography (bottom).
The genesis of this fenland lidar project lay with the offer of newly captured EA lidar data to the Witham Valley Archaeological Research Committee back in 2005. Its remarkable potential for mapping the fenland landscape was immediately apparent and there began a long process of ever more ambitious data requests (under the much more restrictive licensing regime then in place; the current open data environment makes all the difference). Initial stages were unfunded, which is to say Heritage Lincolnshire/Archaeological Project Services were paying for the bits that didn't happen in my own time. Pulling it all together into a uniform processed dataset which could be shared relied on Historic England funding and resulted in the project reports below (some examples from which are presented here also). Addition of the Lincolnshire Marsh and Cambridgeshire/Norfolk fens was an unfunded and rather piecemeal project undertaken once the data became more freely available. Subsequent projects undertaken through York Archaeology have allowed refinement of workflows for large mosaic production and generation of the National Lidar Programme fenland mosic. Where it is not entirely seamless, this is a result of different ground state (as often as not crop growth) across survey seasons responding differently to the applied hill shade.
The original processing style was governed by the essentially topographic aims of the project (to define the landscape setting of archaeological features, rather than necessarily to prospect for the unknown). This style was also somewhat platform dependent, created using MapInfo (v7.8 and upgrades to v9.0) which had a rather different approach to production of hill-shades. The NLP dataset has been processed and assembled using the Relief Visualization Toolbox and QGIS, from which the XYZ tiles have been exported. It comprises a simple hillshade (A315 H35 Ve10) merged with a custom colour ramp. As with the original project, the depiction of fine-scale topography through this colour ramp was the main aim so I have eschewed any other (non-directional) visualisation techniques (for now).
The Car Dyke south of Garwick (north is to the left). The channel and embankments of the Roman canal show clearly along the higher ground at the fen edge.
The original mosaic was based on the 2m-centred Digital Surface Model dataset which at the time provided the widest coverage. 2m was nonetheless sufficient to resolve the generally large-scale topographic features and allowed mapping at 1:5000 across the entire area. DSM was initially preferred since tree cover is hardly an issue in this landscape and it provides better mapping of contemporary settlement (the pattern of which is equally dependent on the underlying topography). The updated mosaic is based on the 1m NLP DTM dataset (I've changed my mind; contemporary settlement can sometimes be a distraction, and I'm not going to make a mosaic quite that large without it having more than one use). The higher resolution available with this data may not yet be apparent via the web platform (the map tile uploads are getting daunting).
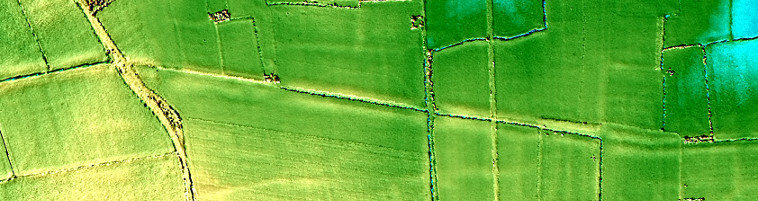
The original colour ramp was designed to make a sharp distinction at the fen edge, effectively the 3m contour, land above this shading from green (3m) to yellow (5m) to brown (10m). The white-blue-cyan scale represents everything below, with the lowest values white. The use of a continuous rather than discrete colour scale makes for a less objective plot (where exactly is 3m?) but is much more expressive of the landscape. One unfortunate aspect of this early approach was that the colour scales defined for Lincolnshire didn't work as well in Cambridgeshire where elevations fall below -2m. Adjustments to the white-blue gradient meant that the map was no longer completely seamless, but now that it is supeseded by the NLP mosaic it will have to stay as it is. One problem with the earlier colour ramp was that areas of the fenland settled in Roman times nevertheless fell within the blue-cyan scale, perhaps giving a misleading impression of what was (or wasn't) 'dry land'. The revised colour ramp therefore uses different intervals with green coming in at 2.5m and yellow at 4m OD. The different impression this gives can be seen in some of the figures below.
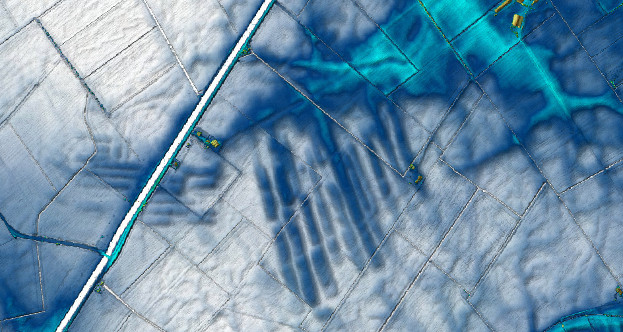
Turbaries in Upwell Fen. The disused Roman peat cuttings have become infilled with flood silts and now stand out against the background of the drained and deflated peat fen. The morphology is distinctive and these can be widely seen along the route of the Fen Causeway and fringing Marshland Fen.
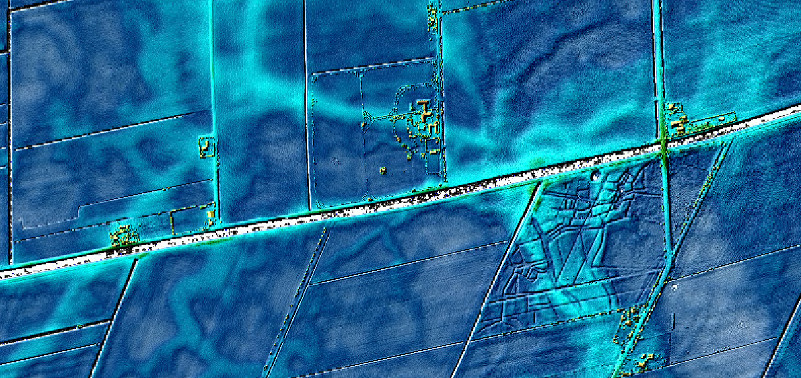
Earthworks of Roman settlement at Shell Bridge with former canalised watercourses to the west and north. The route can be traced seawards to a possible outfall into the Nene estuary near to Long Sutton.
References
Bennett, R., Welham, K., Hill, R.A. and Ford, A. 2012 'A Comparison of Visualization Techniques for Models Created from Airborne Laser Scanned Data', Archaeol. Prospect. 19, 41–48.
Doneus, M. 2013 'Openness as Visualization Technique for Interpretative Mapping of Airborne Lidar Derived Digital Terrain Models', Remote Sensing 5(12), 6427-6442
Historic England 2018 Using Airborne Lidar in Archaeological Survey: The Light Fantastic, Swindon
Kokalj, Ž. and Somrak, M. 2019 'Why Not a Single Image? Combining Visualizations to Facilitate Fieldwork and On-Screen Mapping', Remote Sensing 11(7), 747.